Explore: This phase of the 5 E’s provides students with a common base of experiences. They identify and develop concepts, processes, and skills. During this phase, students actively explore their environment or manipulate materials. (from Enhancing Education http://enhancinged.wgbh.org/research/eeeee.html)
The purpose of the explore phase is for students to get some hands-on experience with tectonics/ earthquakes and volcanoes and to provide scaffolding for more detailed learning in the Explain phase. Students are going to find tectonics associated events, such as volcanoes and earthquakes, more exciting than tectonic plate theory itself, so spending time on these events and fitting them into plate theory, will ensure students gain a deep understanding of plate tectonics.
By the end of the explore phase:
Lesson 2. Exploring Plate Tectonics – Students will be able to recall the earth’s structure, understand the theory that the lithosphere is broken into plates which move around due to convection currents, recognise the large plates, recognise where Australia is on the Indo-Australian plate and to understand the different types of plate boundaries (converging, diverging, transverse).
Lesson 3. Exploring volcanoes and earthquakes – Students will recognize volcanoes occur mostly on plate boundaries, although not all. Students will recognise there are different kinds of volcanoes and the volcanoes appearance has to do with the composition of the lava erupted from it. Students will recognize earthquakes occur mostly on plate boundaries but can occur in other areas due to minor faults. Students will recognise earthquakes are measured in terms of magnitude (or amount of shaking) and that different soil types and building materials, as well as the magnitude, will determine the destructive damage in an area experiencing an earthquake. Students will recognise that earthquakes can cause tsunami waves.
Lesson 2. Exploring Plate Tectonics
- Introduction: The hook I would use to start this class is replaying the Alfred Wegener YouTube clip from the last class (see the Engage phase) and draw up a list of what we know, what we think we know and what we want to learn on the board, compiled from students homework. Most kids will wont to know how volcanoes erupt and why earthquakes happen so these will be on the want to learn list.
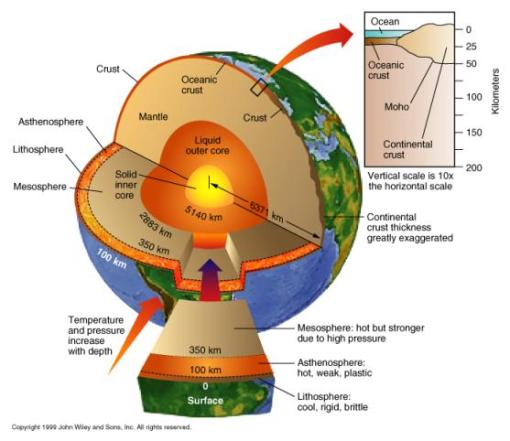
The earth’s structure isn’t too difficult to comprehend, but it is important that students know all the parts and properties to understand convection currents and plate movement. I have seen some long-winded classes spent on earth’s structure cutting up eggs etc – but, by year 9, it is likely students would have already seen pictures of the earth with a core/mantle and crust. to gain a knowledge of the earth’s structure I would put up a picture of the earth on the interactive whiteboard/ class computer and some written text about the structure of the earth and get students to draw a labelled slice of the earth and dot point summary to describe the properties of the components.
so…
Explore Activity 1. The Earth – whats inside?
- Teacher will display the following image on the board/ interactive white board

- Teacher will provide students with text describing each of the layers in detail (an example of the make-up of the layers can be found in my “What is the earth?” post. Students will be asked to draw a diagram of a slice out of the earth (pizza slice shape) in their log books, to label the diagram and summarize the properties of each component in point form next to the label (properties would be derived from the text).
- The teacher could draw a slice on the board and students could label the parts and give properties on request from the teacher as formative assessment (or log books handed in at the end of the class). It is vital that students understand the asthenosphere + crust = lithosphere and the lithosphere is broken into plates that sit over the mantle. It is also important students have acknowledged the fluid properties of the asthenosphere and mantle to understand convection currents.
The next logical steps would be to look at the lithospheric tectonic plates then convection currents and then boundary types.
Students would have seen a picture of the world map with tectonic plates on it in the last class (see Engage phase) – I think it would be useful for students to see this map both in 2D and 3D formats. I think it would be a good idea for students to stick a map of the earth, with its tectonic plate boundaries, into their log books to refer back to and add to as the unit progresses. It is important students understand the nature of the plates being able to move to some degree. I have been playing around with this concept and thought perhaps a lamington tin with golden syrup mixed with a little red food colour could be set up in the class with clear contact covered “jigsaw” of the tectonic plates assembled on top. This would allow students to see the plates can move and can then be used to demonstrate why they would move with convection currents (in fact the cake tin could even be put on a heat source as it would then move the plates around…)
I just tried this demonstration to see if it works!!!
It works very well… but needs a bit of improvement. firstly – i didn’t have a lamington tin so my A4 paper was slightly smaller than the baking pan I used instead… I would make sure the map fits perfectly into the pan (not too difficult as you can photocopy it larger or smaller. I didn’t contact the paper and it worked fine still. I would have used a glass Pyrex lasagna dish if I had one – so you could see the lovely red mantle and it would be easier for the class to see. I would also have used more golden syrup since I only used a layer a about a cm deep – perhaps a couple of cm would be better…
My map I used has its good points and bad points – the bad point is that the Australian plate is cut in half – the good point is the colour coding which does make it easier to visualize the plate concept. I think it is probably the best I have found for this demonstration – as I said in the “plate tectonics” post, I liked it because it had the plate boundaries running through NZ and not all of them do… I would put arrows on the plates too – to show the direction the plate moves in…
So I put my pan on a heat source… I held it on-top of a light candle (actually so the candle was over the oceanic ridge…) and it does indeed move the plates – in-fact it moved the plates apart at the ridge and lifted the paper if I put the candle flame mid-plate… so all up a very good demonstration.
Explore Activity 2: Convection, dragging, bumping and sliding
- Students will stick plate tectonic map into their logbooks and will view the 3D plates on Google Earth http://bbs.keyhole.com/ubb/ubbthreads.php?ubb=download&Number=138517&filename=286222-PB2002.kmz
- Teacher will demonstrate plates on magma using golden syrup/ paper demonstration – students will see they have the ability to move about
So after establishing in the minds of the students that the plates CAN move about and that is why “continential drift” actually occurs we need to let them know the movement is actually quite consistent – e.g. Australia is moving at 35degrees east of north at a rate of 6cm per year and other plates are also moving at a relatively consistent rate… so what is moving the plates? So this is where convection currents would come in…
To demonstrate convection currents better I thought perhaps showing the students a lava lamp would be the way to go… I have found some demonstrations with lava lamps and convection currents – like at the Burke Museum of Natural History website http://www.washington.edu/burkemuseum/earthquakes/bigone/science.html – if a lava lamp is not available then there are 5,630 of them on YouTube… this is one of the better ones… Uploaded by nackuk on Jan 13, 2007.
Students would, more than likely, have come across convection when doing weather or climate change topics but would not necessarily be able to immediately apply that understanding the theory of convection currents in the mantle. Students would also have had experience with states of matter and buoyancy from year 7 and 8 (see Australian National Curriculum content descriptions here http://www.australiancurriculum.edu.au/Science/Curriculum/F-10), so would be familiar with the concept of things becoming less dense when they are heated up and density being related to buoyancy. The lava lamp gives a good visual demonstration of convection currents which could be transferred to the mantle convection current concept without too much imagination… it would make a good Predict Observe Explain demonstration too if you had a lava lamp in the classroom.
Once students have grasped the concept of convection currents we could then apply a heat source to our pyrex dish and indeed see that the plates will move about. from this point remind, students that the plate movement is not random… our plate is moving north-east, other plates are moving in different directions being dragged by convection current cells (the cells themselves forming in consistent regions in the mantle and circulating in a particular direction to form a cell…
- Teacher asks the question: What moves the plates about? – hint – the Indo-Australian plate is being moved north-east and other plates are being moved in the direction of the arrows on them…
- Question: What is convection? lets look at a lava lamp. Who knows how it works? what happens to the particles of a liquid when it heats up?
- Teacher and students discuss convection and the concept of convection currents with teacher asking questions to jog students memories of the concepts.
- Predict- Observe- Explain: Go back to the syrup/paper demonstration and apply heat – get students to predict what will happen if you apply a heat source. Apply the heat source over the atlantic ridge – students will observe and then attempt to explain what would be occurring to move the plates.
- Teacher will explain the concept of a “convection cell” which continually drags a plate around.
Show students the general direction each plate is being dragged because of convection currents – I would use the map they are used to seeing and add arrows to it…

Back to the demonstration with my paper plates and the golden syrup mantle (it may be useful to do these demonstrations with a webcam if it is available – so the whole class can see while seated rather than crowding around…). Get students to note that the plates are all moving in different directions – some are being dragged together (e.g. South American and Nazca Plate), some are being dragged apart (e.g. South American and African plates) and some are being dragged sideways to drag of others (e.g. with parts of the Indo-Australian plate and Eurasian plate. You can demonstrate what happens with the golden syrup plates using fingers to slide the plates around… If you move just the South American plate it will push into and recede under the Nazca Plate and will leave a gap of visible golden syrup. What happens to the mantle magma when it is exposed to the surface? it cools to a solid and forms new oceanic crust – this happens continuously and is called sea floor spreading.
A fantastic animation can be found here (click where it says convection currents)
convection currents from Absorb Learning http://www.absorblearning.com/media/item.action?quick=12p
So this would lead into the 3 plate types – converging, diverging and transform
Instruct students to draw a diagram of the three types and label them – Converging (CRUSHED TOGETHER), Diverging (DRAWN APART) and Transform (TRYING TO SLIP AWAY).
- Teacher will demonstrate plates moving with the syrup/ paper demonstration. Students will observe subduction, plates being moved apart to expose syrup etc and will participate in discussion, as described above. Students will observe animation of plate movement indicating subduction and sea floor spreading above
- Students will draw labelled diagrams of the 3 types of boundary interactions and write a description of sea floor spreading
- Students will transpose the arrows from the map to the map in their log books to recall the direction each of the plates are moving in.
- http://www.teachersdomain.org/asset/ess05_int_shake/ is a fantastic link (I just found!!!) – interactive plates – you can push them to see what happens with transform boundaries, drag them together to see what happens with convergent boundaries and drag them apart to see sea floor spreading in action.
I have been playing around with ways to visually represent subduction zones – I think the animation above is very good at visualising subduction. If students have difficulty with the concept though I played around with using different materials to demonstrate this. Most websites say polystyrene – it doesn’t indicate differences in density between oceanic crust and continental crust though… The best solution I found was squares of corrugated cardboard. If you wet one piece of the corrugated cardboard and left the other piece dry, the wet/more dense piece does subduct under the dry piece – and the dry piece ripplies up a bit as the wet piece subducts underneath.
- Predict- Observe- Explain: Teacher will show students what happens at converging plate boundaries where one plate boundary is oceanic and the other is continental by using wet corrugated cardboard demonstration (see above). Student could also be given similar squares of cardboard to play around with to determine what would happen if two of the pieces were dragged together. Teacher will ensure the students get the idea of mountains and subduction associated with these boundaries.
- Show students the clip from How Stuff Works – about the discovery of mid ocean ridges and how sea floor spreading and subduction balance out the area of earths crust http://videos.howstuffworks.com/science-channel/29268-100-greatest-discoveries-sea-floor-spreading-video.htm.
- Teacher will give students the following task for homework and will reflect on what was learned in the class. Teacher will encourage students to keep their log books up to date with notes and put the answer to their questions in their log books (will be collected in the next class to ensure students are all on the right track) and do their regular summary and reflection.
- Explain why the earth is 4.5 billion years old but the oldest oceanic crust is 200 million years old.
- What is the alternative name commonly given to tectonic plate boundaries? (hint – think of earthquakes)
- By looking at your tectonic plate map, describe why the Himalaya Mountains are being formed
Lesson 3: Exploring volcanoes and earthquakes
- Teacher will introduce the class by playing a YouTube clip of a volcano erupting.
- Teacher will give students a handout to stick in their log books of current active volcanoes (or will email the map if students are doing a blog or wiki (from http://geophysics.ou.edu/geol1114/notes/volcanoes/volcanic.html)

- Think, Pair, Share – What can you tell me about this map? Lead students to the point that most volcanoes occur on plate boundaries and most also lie in a ring, called the Ring of Fire on the map, made up of the convergent boundaries around the Pacific Plate and Nazca Plate.
- Explore Google Earth Volcanoes. Google Earth should already be loaded onto computers – students will be advised to go to the Global Volcanism website http://www.volcano.si.edu/world/globallists.cfm?listpage=googleearth and click on the links to the kml files for the holocene and current activity volcanoes (plate boundaries/ plate boundary types are also switched on).
- Students will explore Google Earth volcanoes and investigate the following
- What volcano types can you find (click on the volcano pictures or triangles)
- Is there a pattern with where volcanoes are in relation to plate boundary types?
- What is the most common type of volcano found near convergent boundaries?
- What is the most common type of volcano found near/ at convergent boundaries?
- Are there any volcanoes at transform boundaries?
- What type of volcanoes are most common intra plate?
- Look at the descriptions of a few stratovolcanoes and shield volcanoes – you will see lava flow indicated on the description – are there differences in the lava type and the way the lava is described to come out of the volcano?
- Class discussion – Teacher will review students answers and will write patterns on the board in a concept or mind map
- Students will see a pattern between volcano types and plate boundaries and will see that shield volcanoes usually have fast flowing lava, while stratovolcanoes have more “tephra”, explosions, cones. lava domes.
- Discuss the relationship between lava and what a volcano looks like – a volcano is really made up of its own lava and sometimes tephra and rock particles it erupts. Volcanoes look different because of different composition of lava. The main element involved in making lava different is silica – the more silica the lava contains the more viscous and sticky it is (think of silicon baking trays – they feel like rubbery plasticky stuff – so silica makes lava more plasticky.
- Describe to students how gas comes out of lava once it reaches the earths crust at a lower pressure. Take a soft drink bottle to class and ask students what is happening when the lid is opened on the soft drink. Open the lid so the students can see no bubbles in the drink becomes bubbles once the pressure in the bottle is reduced.
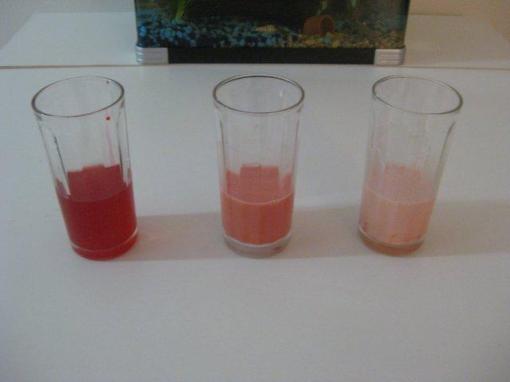
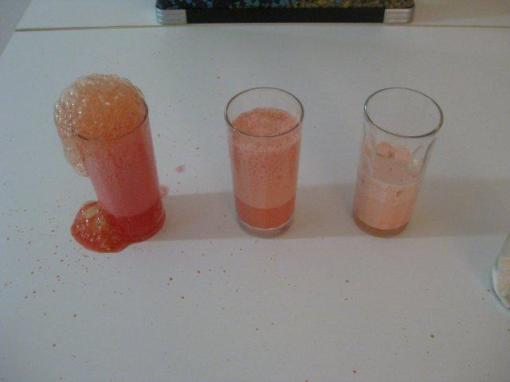
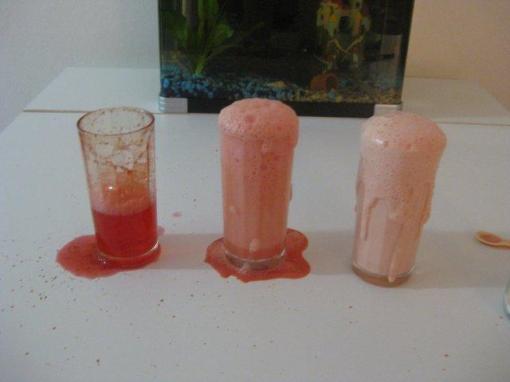
- Predict, observe, explain: Here we have 3 magma chambers – the first contains basalt lava with a low silica content, the second contains lava with a medium silica content and the third contains lava with a high silica content. When the lava/ magma reaches lower pressure and the gasses come out of the lava what do you think will happen? acknowledge each idea suggested.
- Add 1 teaspoon of bicarb quickly to each of the volcanoes and stand back…
- Teacher will take students through Google Earth’s USGS earthquake real time overlay http://earthquake.usgs.gov/earthquakes/catalogs/eqs7day-age.kmz from http://earthquake.usgs.gov/learn/kml.php
- Students will see and acknowledge earthquakes, particularly the larger ones, occur mostly at or just near plate boundaries
- What is MAGNITUDE? listed on each of the earthquake dots. You will see on each of the dot’s link to the USGS website a reference to the tsunami risk – what is a tsunami?
- The Magnitude is a number that characterizes the relative size of an earthquake. Magnitude is based on measurement of the maximum motion recorded by a seismograph – a device used to measure seismic waves (which you will learn about in the next soon). Why do you think that some earthquakes cause major destruction to buildings while others of the same magnitude, in different places, do not? It could be the strength of buildings, height of buildings, material the buildings are made out of, type of soil perhaps? Today we are going to make a shake table to simulate an earthquake and you are going to design and investigation to see if soil types or building heights/shapes make a difference to the damage caused by an earthquake.
- Take students through how to make their shake table, buildings and how to prepare soil types for testing. Remind students that they will need to have a control group and a test group for each investigation – the control group would be the bedrock example where houses are placed on a play dough filled tray.
- Students will be instructed to design an investigation to determine if soil types, building height or construction have an impact on damage caused by earthquakes using an earthquake simulation (the process or the earthquake simulation will be demonstrated prior to letting students loose on their investigative design. Students will work in teacher allocated groups of 3 for this investigation and students can run their test several times using different materials (providing they use fair testing practices for each run). Students will fill in a fair test pro-forma – i.e.
What is the question?
__________________________________________________________________________________
What is the independent variable (what are you going to change?)
__________________________________________________________________________________
What is the dependent variable (what are you going to measure?)
__________________________________________________________________________________
What are the other variables (that need to be kept the same?)
__________________________________________________________________________________
Draw a diagram of your investigation
What are your results:
__________________________________________________________________________________
How can you represent your data?
__________________________________________________________________________________
What do your results mean?
__________________________________________________________________________________
How would you improve on your investigation?
__________________________________________________________________________________

Constructing the shake table – each class will construct one of these
The soil types will be pre-prepared as follows…

Bedrock is made from playdough
Gravel is made from Norganic Crunchola cereal (as a substitute for grape-nuts used in the original demonstration)
The Alluvium is made by mixing 3 cups of Norganic Crunchola with 1 cup of water
The Sand is made by mixing 3 cups of water with 1 1/2 cups of Coles cornflour. Cornflour is added to the water in small amounts at a time to form the slurry (which has properties much like liquefied soil….)
the trays should be filled to the same level with each of the soil types

Buildings made from sugar cubes and peanut butter or sunflower butter.
The trays with soil types are placed on to the shake table tray and houses put on the top – each shake tray should fit 2 soil trays – a control and a test. The shake table is shaked in a routine way – i.e. say 20 medium shakes. A student with a stop watch can time when the first building damage occurs and first wall falls down (and any other observations).
I would allocate roles for students in this investigation – the manager, speaker and director. Manager can gather materials, use the stop watch and control the groups noise levels, speaker can record results and communicate with the teacher if the group needs anything and at the end when discussing results, the director can do the table shaking and ensure other group members are keeping to task.
Sugar cubes can be purchased in bulk from CSR sugar.
- After the investigation, class will discuss results, the meaning of the results and how this relates to disaster management in developed countries


November 30, 2011 at 5:55 pm
CoOl 🙂 ExpEriMenT ………!!!!!
October 28, 2012 at 3:32 pm
Your style is really unique compared to other people I have
read stuff from. Thanks for posting when you have the opportunity,
Guess I will just bookmark this blog.
Gilbert